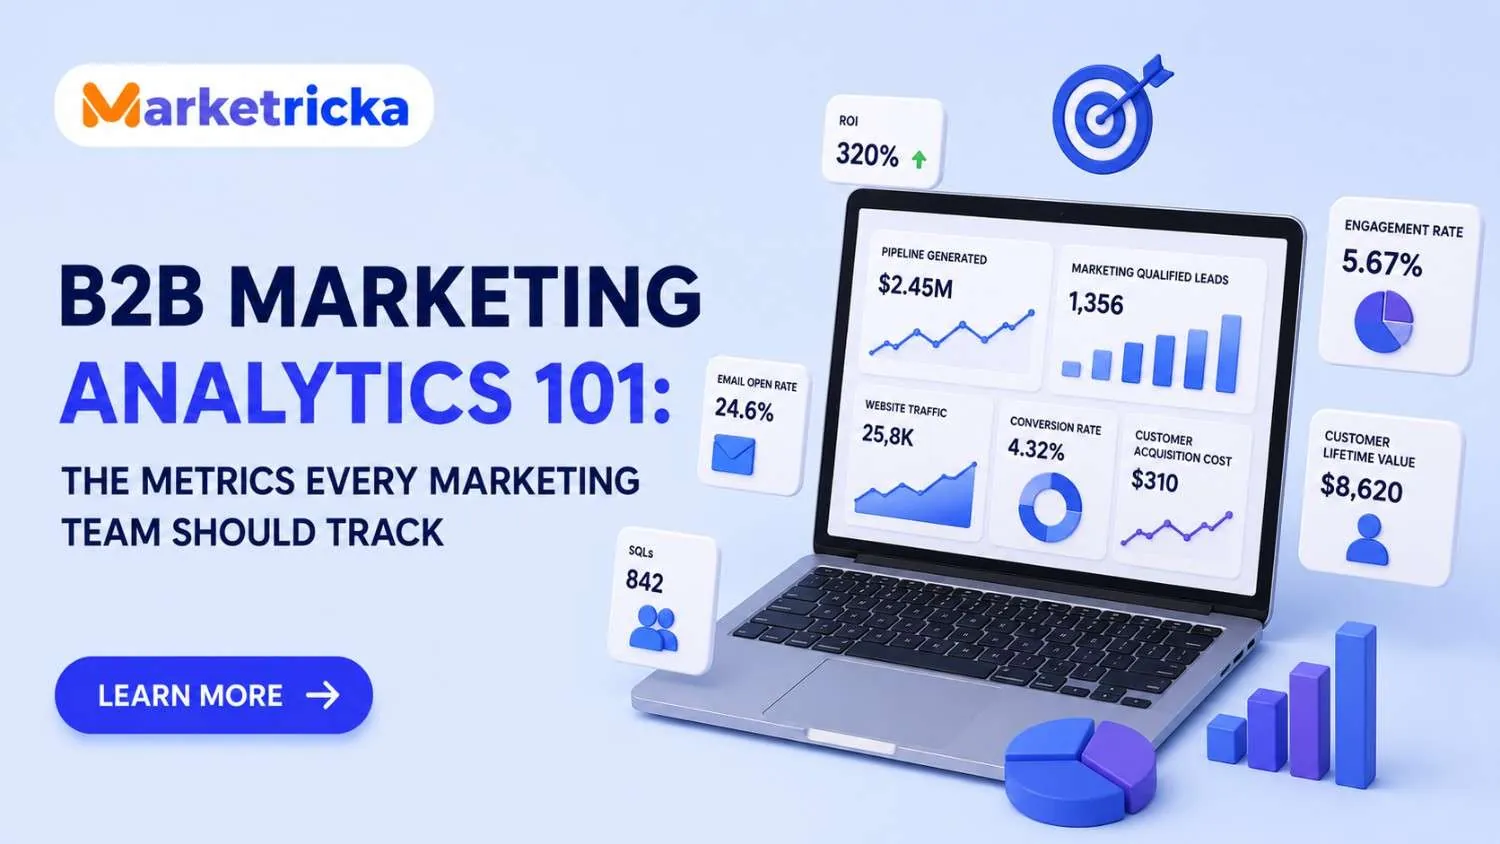
B2B Marketing Analytics 101: The Metrics Every Marketing Team Should Track
Master B2B marketing analytics with key KPIs, MQL-to-SQL, CAC, attribution, and 2026 benchmarks to drive pipeline and revenue.
B2B marketing has never been more measurable. And for most teams, never more confusing.
Campaign data sits in Google Analytics. Lead data lives in HubSpot or Salesforce. Attribution lives in a spreadsheet someone built two years ago that nobody fully trusts. And every month, the same question comes up in the pipeline review: which marketing actually drove this, and which of it was just noise?
That is what B2B marketing analytics is supposed to solve. Not reporting for its own sake, but the systematic process of measuring which campaigns generate qualified pipeline, which channels produce revenue-ready leads, and where buyers drop off before they ever reach sales.
This guide covers the full framework: the definitions, the metrics that matter at each funnel stage, the formulas, 2026 benchmarks from the research, and the best practices that separate analytics that drive decisions from analytics that just produce charts.
What Is B2B Marketing Analytics?
B2B marketing analytics is the practice of measuring, tracking, and analyzing marketing performance to understand which activities generate qualified leads and contribute to revenue. The core purpose is to help marketing, sales, and RevOps teams make faster, informed decisions about where to invest, what is working, and how to generate more pipeline from the right accounts.
B2B analytics is structurally different from B2C for one key reason: buyers do not impulse-purchase a $50,000 software contract after seeing one ad. B2B sales cycles stretch from 60 to 180 days. Multiple stakeholders are involved. A single contact rarely represents the full buying committee. Because of this, B2B marketers measure account-level engagement, pipeline velocity, and revenue attribution, not individual transaction conversion rates.
The practical implication: your analytics framework needs to connect marketing touchpoints at the individual and account level all the way through to closed-won revenue. Stopping at MQLs or traffic gives you activity data, not insight.
This is the foundation of every effective data-driven marketing strategy. You do not just collect data about campaigns. You build a system that connects that data to the decisions that drive revenue.
Marketing Metrics vs. Marketing KPIs: Know the Difference
Every metric is a data point. Not every data point deserves a place on your dashboard.
A metric is any measurable number: page views, email opens, ad impressions. A KPI (key performance indicator) is a metric tied directly to a business objective. The risk in B2B marketing is dashboard bloat tracking 30 numbers and being unable to confidently answer whether marketing is growing the pipeline.
The distinction between leading and lagging indicators matters here:
Leading indicators: MQL volume, pipeline coverage ratio, website engagement by ICP segment. These signal what is likely to happen in future quarters and are what you optimize week-to-week.
Lagging indicators: customer acquisition cost (CAC), marketing-sourced revenue, customer lifetime value (CLV). These confirm what already happened and are what you use in strategy reviews and budget conversations.
High-performing B2B teams track both. Leading indicators for agile decision-making. Lagging indicators for strategic validation. Relying exclusively on one type creates blind spots either in forecasting accuracy or in understanding whether current activity is actually efficient.
Pro Tip: Set 3-5 true KPIs tied to business objectives, then use supporting metrics to explain the story behind them. If your CMO cannot read your dashboard in 90 seconds, it has too many metrics.
The B2B Marketing Metrics Every Team Should Track: Complete Reference
Below is the full reference set. Organized by funnel stage, with formulas, category, and 2026 benchmarks drawn from First Page Sage, MarketJoy, ZoomInfo, and industry research.
Metric | Formula / What It Measures | Category | 2026 Benchmark |
|---|---|---|---|
MQL Volume | Total marketing-qualified leads generated per period | Demand Gen | Varies by segment |
Lead-to-MQL Rate | MQLs Generated ÷ Total Leads × 100 | Lead Quality | 31% avg (B2B SaaS: 39%) |
MQL-to-SQL Rate | SQLs Accepted ÷ MQLs Generated × 100 | Lead Quality | 13% avg; top: 25-35% |
SQL-to-Opportunity | Opportunities Created ÷ SQLs × 100 | Pipeline | 10-12% avg |
Opportunity-to-Close | Closed-Won ÷ Opportunities × 100 | Revenue | 6-9% avg (SMB 39%) |
Cost Per Lead (CPL) | Total Campaign Spend ÷ Leads Generated | Demand Gen | $50-$500 (industry varies) |
Cost Per MQL | Total Spend ÷ MQLs Generated | Lead Quality | Higher CPL, better quality |
Customer Acquisition Cost | Total Sales & Marketing Spend ÷ New Customers | Revenue | Max 1/3 of CLV |
Pipeline Contribution Rate | Marketing-Sourced Pipeline ÷ Total Pipeline × 100 | Pipeline | 40-50% healthy range |
Marketing-Sourced Revenue | Revenue from marketing-originated deals | Revenue | Varies by GTM model |
Marketing ROI | (Revenue Attributed - Spend) ÷ Spend × 100 | Revenue | >300% considered strong |
Pipeline Velocity | (Opps × Avg Deal Size × Win Rate) ÷ Cycle Length | Pipeline | Track weekly for 34% revenue lift* |
Sales Cycle Length | Days from first marketing touch to closed-won | Pipeline | 60-180 days typical B2B |
CLV (Customer Lifetime Value) | Avg Revenue Per Customer × Avg Retention Period | Revenue | Target 3x CAC or higher |
Landing Page Conv. Rate | Conversions ÷ Total Visitors × 100 | Demand Gen | 2.9% avg; legal/finance 5-7% |
Demand Generation Metrics: Measuring the Top of Your Funnel
Demand generation metrics tell you how effectively your top-of-funnel programs are filling the pipeline. The instinct to optimize these for volume is common and usually wrong. High MQL volume with a low MQL-to-SQL rate is not a demand generation success. It is a qualification failure that is just further upstream.
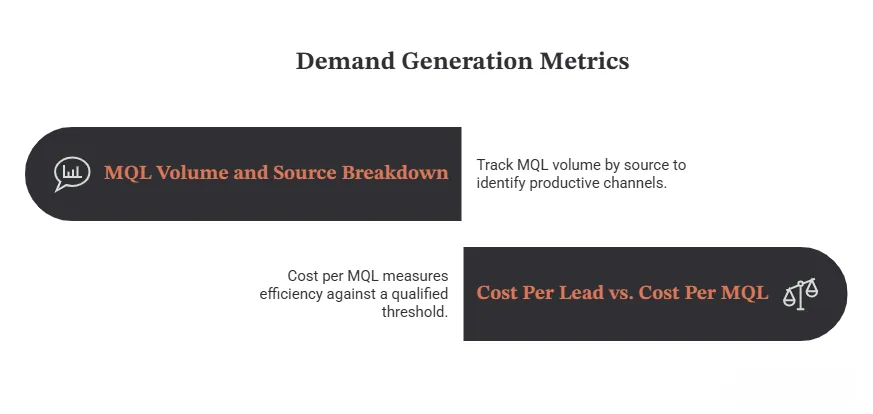
MQL Volume and Source Breakdown
Track MQL volume by source: organic, paid, email, webinar, referral, events not in aggregate. Aggregate MQL numbers hide the story. A channel producing 40% of your MQLs but 5% of your SQLs is not a productive channel. It is a lead inflation machine.
31% Average Lead-to-MQL conversion rate across B2B industries
First Page Sage, 2025 — B2B SaaS achieves 39%
Cost Per Lead vs. Cost Per MQL
These are different metrics that get conflated constantly. CPL measures acquisition efficiency at the very top of the funnel. Cost per MQL measures efficiency against a qualified threshold. A channel with a $50 CPL but a 5% MQL rate is producing $1,000 cost-per-MQL. A channel with a $200 CPL and a 40% MQL rate produces $500 per MQL. The second channel is twice as efficient despite looking expensive at first glance.
Channel-level CPL benchmarks for 2026: Google Ads averages $48.96 CPL with 3.75% conversion; LinkedIn Ads cost more but produce significantly higher MQL-to-SQL rates (18-28% vs. Meta's 5-10%). For B2B SaaS, LinkedIn CPL of $150-$300 is typical with far stronger downstream qualification.
Pro Tip: Never evaluate channel efficiency on CPL alone. Track CPL, cost-per-MQL, and MQL-to-SQL rate together. Only then can you see the true cost per qualified pipeline opportunity.
Lead Quality Metrics: MQL, SAL, SQL Explained
These three stages are the foundation of B2B pipeline measurement and the most commonly misconfigured part of any marketing analytics setup.
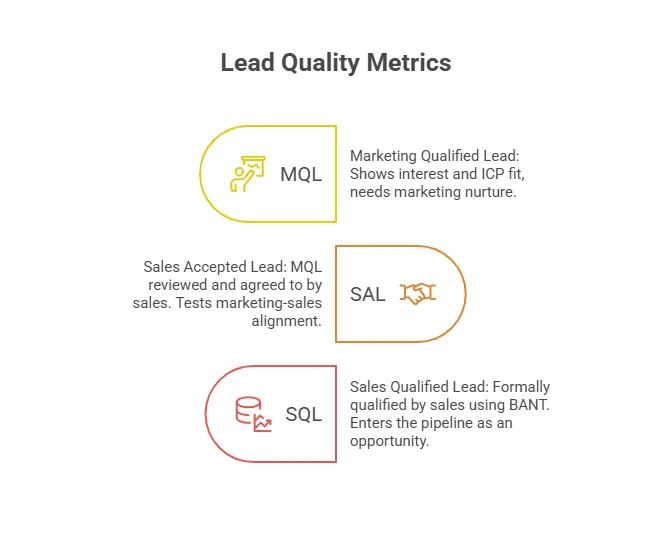
MQL (Marketing Qualified Lead): A prospect who has shown sufficient interest and ICP fit to warrant marketing nurture but has not yet been evaluated by sales. Qualification should combine behavioral signals (pricing page visits, demo views, content downloads) with firmographic fit (company size, industry, role).
SAL (Sales Accepted Lead): An MQL that sales has reviewed and agreed to pursue. The SAL stage is where marketing-sales alignment is tested. A low SAL rate means sales is rejecting MQLs either because the leads do not fit ICP criteria or because the scoring model is too loose.
SQL (Sales Qualified Lead): A prospect that sales has formally qualified using BANT or a similar framework — budget, authority, need, and timeline confirmed. SQLs enter the pipeline as real opportunities.
The MQL-to-SQL conversion rate is the single most diagnostic metric in B2B marketing. It does not just measure lead volume. It measures whether marketing and sales share the same definition of a qualified lead.
13% Cross-industry average MQL-to-SQL conversion rate
First Page Sage — B2B SaaS top performers achieve 25-35%; behavioral ICP scoring reaches 39-40%
When MQL-to-SQL falls below 10%, it is a reliable signal that scoring criteria need revisiting. When it exceeds 25%, it usually means the scoring model is tight, the handoff process is clean, and marketing and sales are aligned on what a qualified lead actually looks like.
Pro Tip: Segment MQL-to-SQL rate by channel, campaign, and persona. SEO-generated MQLs convert at 51%; LinkedIn at 18-28%; Meta at 5-10%. Aggregate rates hide which sources are actually building pipeline.
Pipeline and Revenue Metrics: Where Marketing Budget Gets Justified
This is where marketing either earns credibility with leadership or gets questioned every quarter. Pipeline and revenue metrics connect marketing activity to actual sales outcomes and they are the numbers that matter in budget conversations and annual planning.
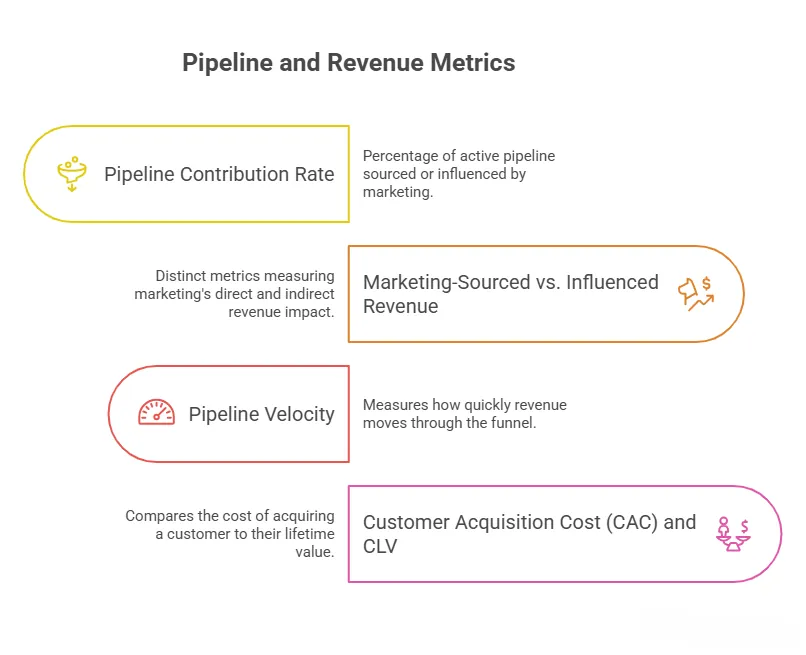
Pipeline Contribution Rate
Pipeline contribution rate measures the percentage of total active pipeline that marketing either sourced or influenced. It is one of the clearest ways to quantify marketing's role in overall revenue generation.
Benchmarks for 2026: a floor of 30% marketing-sourced pipeline is considered minimum viable; 40-50% is healthy for most B2B teams; above 60% represents stretch performance (Martal Group, B2B Digital Marketing Benchmarks 2026). The right target depends on your GTM model. Product-led growth companies skew lower; demand-gen-heavy models should hit 50%+.
Marketing-Sourced vs. Marketing-Influenced Revenue
These are distinct metrics that measure different things. Marketing-sourced revenue credits only deals with marketing originated where a marketing touchpoint was the first interaction. Marketing-influenced revenue captures any deal where marketing had at least one meaningful touchpoint, regardless of origination.
Tracking both matters because influenced revenue shows the full scope of marketing's contribution, especially in long B2B sales cycles where sales develops a lead that marketing initially qualifies. Reporting only sourced revenue systematically undercredits content, nurture, and brand programs that support deals in motion.
Pipeline Velocity
Pipeline velocity is one of the most underused metrics in B2B marketing analytics. It measures how quickly revenue moves through the funnel:
Pipeline Velocity = (Number of Opportunities × Avg Deal Size × Win Rate) ÷ Sales Cycle Length
Organizations tracking pipeline velocity weekly show 34% revenue growth versus 11% for teams that review it irregularly (The Digital Bloom, 2025). It is the single metric that captures funnel efficiency, deal quality, and sales cycle health in one number.
Effective sales funnel automation directly improves pipeline velocity by eliminating manual handoffs, reducing follow-up lag, and ensuring no qualified lead sits unworked past the first hour which research shows reduces conversion rates dramatically.
Customer Acquisition Cost (CAC) and CLV
CAC is the total sales and marketing investment required to acquire one new customer:
CAC = Total Sales & Marketing Spend ÷ Number of New Customers Acquired
CAC in isolation is meaningless. It must always be read alongside CLV. The standard B2B benchmark: CAC should not exceed one-third of customer lifetime value, meaning a 1:3 CAC-to-CLV ratio is the minimum for sustainable acquisition economics. Below that threshold, you are acquiring customers at a loss once you account for the full cost of winning and serving them.
Tracking CAC by channel reveals which acquisition paths are most efficient. A channel with a $3,000 CAC that brings in $25,000 CLV customers is more valuable than a channel with a $1,500 CAC bringing in $6,000 CLV customers. This is the calculation that drives intelligent budget allocation and data-driven marketing decisions at the channel and campaign level.
B2B Marketing Attribution Models: Which One Does Your Team Need?
Attribution is the operational backbone of accurate B2B marketing analytics. Without a clear model, every downstream metric CAC, ROI, pipeline contribution is unreliable. B2B buyers interact with 6 to 10+ touchpoints before a purchase decision. Single-touch models systematically undercredit mid-funnel and bottom-funnel campaigns, distorting the perceived value of nurture, retargeting, and sales enablement content.
Model | How Credit Is Assigned | Best For | Key Limitation |
|---|---|---|---|
First Touch | 100% to first interaction | Understanding what creates awareness | Ignores all nurture activity |
Last Touch | 100% to final interaction before conversion | Closing-tactic measurement | Undercredits mid-funnel entirely |
Linear | Equal credit across all touchpoints | Balanced multi-channel views | Does not weight key moments |
Time-Decay | More credit to recent interactions | Short sales cycles (30-60 days) | Undervalues awareness campaigns |
W-Shaped | 30% first, 30% lead creation, 30% opp creation, 10% rest | Most B2B demand gen programs | Complex to implement cleanly |
Full-Path | Credit at four key milestones including closed-won | Enterprise full-funnel reporting | Requires clean CRM stage data |
The right model matters less than applying one model consistently. Switching attribution models mid-year invalidates all historical comparisons and destroys the credibility of ROI reporting with finance and leadership. Pick a model, document it, and apply it consistently across all reporting periods.
Pro Tip: Run two attribution models simultaneously for 90 days — last-touch and W-shaped. The gap between how each model credits your channels reveals exactly where your top-of-funnel and mid-funnel programs are undervalued.
How to Track B2B Marketing Metrics: The Right Cadence
The question is not just what to track but how often to review it. Different metrics operate on different time scales, and reviewing everything at monthly intervals means you are always behind on what matters now.
Review Cadence | Metrics to Review | Decision It Informs |
|---|---|---|
Daily / Real-time | Paid ad spend pace, pipeline anomalies, high-intent account signals | Bid adjustments, sales alerts, real-time campaign optimization |
Weekly | MQL volume by source, CPL by channel, MQL-to-SQL rate, pipeline velocity | Channel optimization, lead scoring adjustments, SDR prioritization |
Biweekly | Pipeline contribution rate, stage conversion rates, deal velocity | Nurture program adjustments, content gap analysis, sales alignment |
Monthly | CAC, CLV, marketing ROI, marketing-sourced revenue | Budget reallocation, program investment decisions |
Quarterly | Attribution model review, full-funnel audit, ICP scoring calibration | Strategy and roadmap, headcount planning, annual targets |
Real-time data matters most where intent signals decay fast. If a target account visits your pricing page, that signal has a 24-hour window before it becomes stale. AI agents in marketing now handle exactly this, monitoring dashboards continuously, flagging anomalies automatically, and routing high-intent signals to sales in real time without waiting for a weekly review cycle.
B2B Marketing Analytics Best Practices That Actually Improve Performance
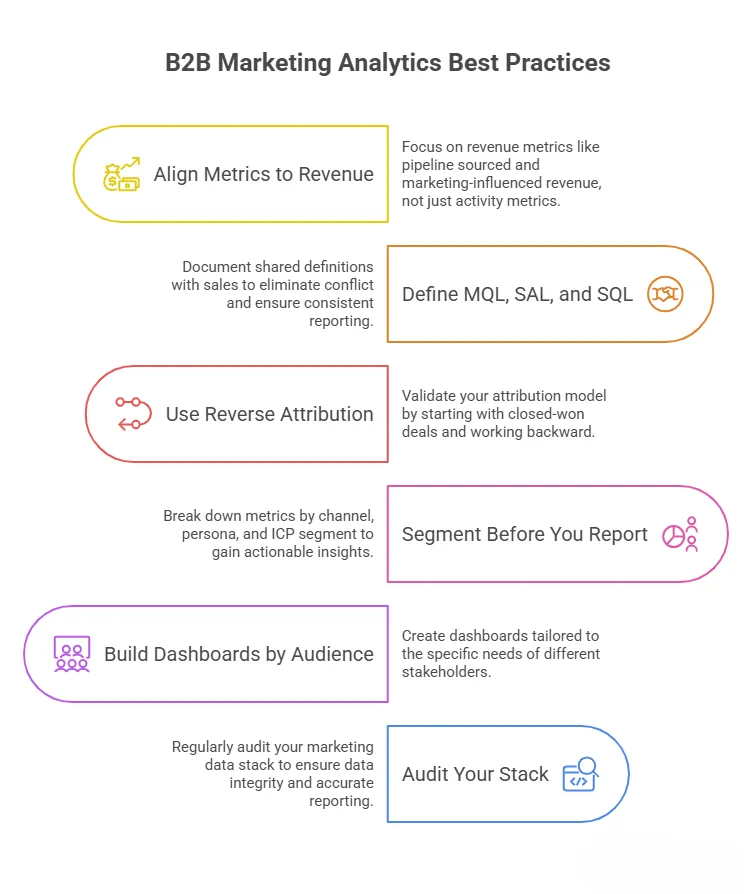
Align Metrics to Revenue, Not Marketing Activity
The most common analytics failure in B2B marketing: reporting stops at MQLs and website traffic. These are activity metrics. Revenue metrics pipeline sourced, opportunity conversion rate, marketing-influenced revenue are what connect marketing to the business outcome. If your dashboards stop before the pipeline, you cannot make a credible case for budget or headcount.
Define MQL, SAL, and SQL in Writing — With Sales
Shared definitions eliminate the most common source of sales-marketing conflict. When marketing defines MQL one way and sales defines it another, every pipeline report generates a dispute rather than a decision. Document the agreed definitions, get sign-off from both teams, and review them quarterly as ICP criteria and lead scoring evolve.
Use Reverse Attribution to Validate Your Model
Start with closed-won deals and work backwards through the touchpoint history. This often reveals that your attribution model is crediting the wrong channels typically the final-touch conversion event rather than the content and campaigns that built intent earlier in the journey. Reverse attribution is how you catch those distortions before they drive bad budget decisions.
Segment Before You Report
Aggregate metrics hide the story. An average MQL-to-SQL rate of 18% might look healthy until you see that organic search generates 51% and paid social generates 5%. Breaking metrics down by channel, persona, and ICP segment is what turns reporting into insight and insight into action.
This segmentation discipline is also what makes customer segmentation actionable. Once you can see how different segments move through your funnel, you can build nurture programs, scoring models, and content strategies that address the specific gaps each segment shows.
Build Dashboards by Audience, Not by Metric
A dashboard built for a RevOps analyst looks completely different from one built for a CMO or a sales leader. The CMO needs a pipeline created, CAC, marketing ROI, and trend lines. The demand gen manager needs channel-level CPL, MQL volume by source, and conversion rates by stage. Building one dashboard for everyone guarantees that nobody finds it useful.
Connecting your analytics to strong data visualization in marketing principles is what makes dashboards actually influence decisions. The insight does not matter if the person who needs to act on it cannot read it in under 60 seconds.
Audit Your Stack Before Adding More to It
Most analytics failures are not tool failures. They are data integrity failures. Broken UTM tracking, inconsistent CRM data entry, attribution windows that differ across platforms these make every report misleading regardless of how sophisticated the analysis. A regular marketing data stack audit catches these problems before they show up as a missed quarter you cannot explain.
Common B2B Marketing Analytics Challenges and How to Address Them
Data silos make attribution impossible. Marketing automation, CRM, and ad platforms do not natively speak to each other. The result: disconnected data, manual reconciliation, and reports that contradict each other across systems. The fix is a unified data layer CDP, clean room, or data warehouse that creates a single customer record your entire stack can reference.
Long sales cycles break standard attribution models. When buyers take 6 to 12 months to convert and touch 15 channels, last-touch or even linear attribution actively misleads you about channel value. Multi-touch models are not optional for enterprise B2B they are the minimum requirement for accurate reporting.
Sales enters CRM data inconsistently. Half your opportunities have missing lead sources. Stage gates get skipped. Close dates move without explanation. When CRM data is dirty, marketing attribution is dirty, regardless of how sophisticated the reporting layer is. CRM discipline is a prerequisite for analytics credibility.
Buying committees are invisible to individual-based tracking. B2B buying decisions involve 5 to 10 people. Most analytics tools track individual contacts, not accounts. Account-level engagement data which is what hyper-personalization and ABM programs run on requires intentional account-level instrumentation, not just contact-level tracking.
Privacy changes are degrading data quality. iOS updates, GDPR compliance, and third-party cookie deprecation mean that touchpoints which were previously trackable now show as unknown sources. The fix is not workarounds. It is a zero-party and first-party data strategy that captures intent directly rather than inferring it from third-party behavioral tracking.
The Metrics That Matter Come Down to One Question
Every B2B marketing analytics framework ultimately answers the same question: is marketing creating qualified pipelines efficiently, and can you prove it?
The teams that answer that question confidently are the ones that have connected touchpoints to revenue, aligned with sales on what a qualified lead actually means, built attribution models that reflect how buyers actually behave, and created dashboards that translate data into decisions fast enough to matter.
Start with the metrics in this guide. Build the tracking discipline around your CRM and UTM structure. Then move from descriptive analytics of what happened toward predictive analytics that tell you what is likely to happen next and which accounts you should be going after now.
That progression from measurement to insight to action is what data-driven marketing actually means in practice. The tools are secondary. Discipline is everything.