Sales Pipeline Velocity: The Key Revenue Metric
Explore how sales pipeline velocity helps experts measure deal flow through the pipeline, improving forecasting accuracy, win rate, and revenue predictability.

Your CRM shows four times your quota sitting in the pipeline. Your team is busy, deals look solid on paper, and everything suggests a strong quarter ahead. But when the quarter closes, you still miss the number.
This is one of the most common (and frustrating) realities in B2B sales. The issue isn’t pipeline volume, it’s visibility into how fast deals are actually moving. Most teams track what’s in the pipeline, but not how efficiently it’s converting into revenue.
That's exactly what sales pipeline velocity fixes. It’s a critical revenue forecasting metric that doesn’t just show pipeline size; it reveals the speed at which opportunities turn into closed deals. For RevOps and sales leaders who want to move from guesswork to predictability, this is the metric that makes the difference.
In this blog, we’ll explore what sales pipeline velocity is, how to calculate it, why it matters for accurate forecasting, and how you can improve it to drive consistent revenue growth.
What Is Sales Pipeline Velocity?
Sales pipeline velocity measures the speed at which qualified opportunities move through your sales funnel and generate revenue. The output is a single, clean number: how many dollars your pipeline produces per day.
Unlike pipeline coverage, which only tells you how much is in the funnel, the pipeline velocity metric tells you whether that pipeline will actually close and when. It's a composite measurement that captures four things simultaneously: deal volume, deal size, conversion effectiveness, and cycle speed.
How to Calculate Pipeline Velocity: The Sales Velocity Formula
The sales velocity formula is straightforward:
Pipeline Velocity = (Number of Opportunities × Average Deal Value × Win Rate) ÷ Sales Cycle Length (in days)
This gives you a daily revenue velocity figure, the dollars your pipeline generates every single day.
A Real Example of How to Calculate Pipeline Velocity
Say your team currently has:
60 qualified opportunities in the pipeline
$20,000 average deal value
25% win rate
80-day average sales cycle
Pipeline Velocity = (60 × $20,000 × 0.25) ÷ 80 = $3,750 per day
That single number gives you more clarity than metrics like MQL count or pipeline coverage. If it starts dropping week over week, it signals that something in your pipeline isn’t working as it should and helps you pinpoint where the problem is.
Each part of the pipeline velocity acts like a separate factor you can influence. If your win rate is low, it points to a sales or enablement issue. If deals are taking too long to close, it’s likely a process problem. And if you don’t have enough opportunities, the gap is in demand generation.
That’s what makes pipeline velocity so powerful; it’s not just a performance metric, but also a simple way to diagnose what’s holding your revenue back.
Why Sales Pipeline Velocity Is the Top Revenue Forecasting Metric
Most revenue forecasting methods depend on gut feel, deal stage weightings, or static pipeline snapshots that age quickly. The pipeline velocity metric solves this by anchoring forecasts to a rate of change, which is a far more accurate predictor of what will close and when.
The research makes the case clearly:
Companies that track sales pipeline velocity weekly achieve 34% annual revenue growth vs just 11% for teams with irregular tracking patterns (First Page Sage, 2025 Pipeline Velocity Study of 247 B2B organizations)
Weekly velocity trackers hit 87% forecast accuracy, compared to only 52% for irregular trackers.
Companies that regularly track sales velocity see 25% higher growth rates than those focusing on other metrics alone
67% of companies lack a formalized forecasting process, and dirty pipeline inputs are the primary reason.
The difference between teams that track velocity weekly and those that don’t is marginal. It’s the difference between a forecast that holds up in board conversations and one that gets revised three weeks into the quarter.
Sales Pipeline Velocity Benchmarks by Industry (2025–2026)
Understanding where your velocity stands relative to your industry is essential context for improvement. Here are current benchmarks based on First Page Sage's analysis of 247 B2B organizations in 2025:
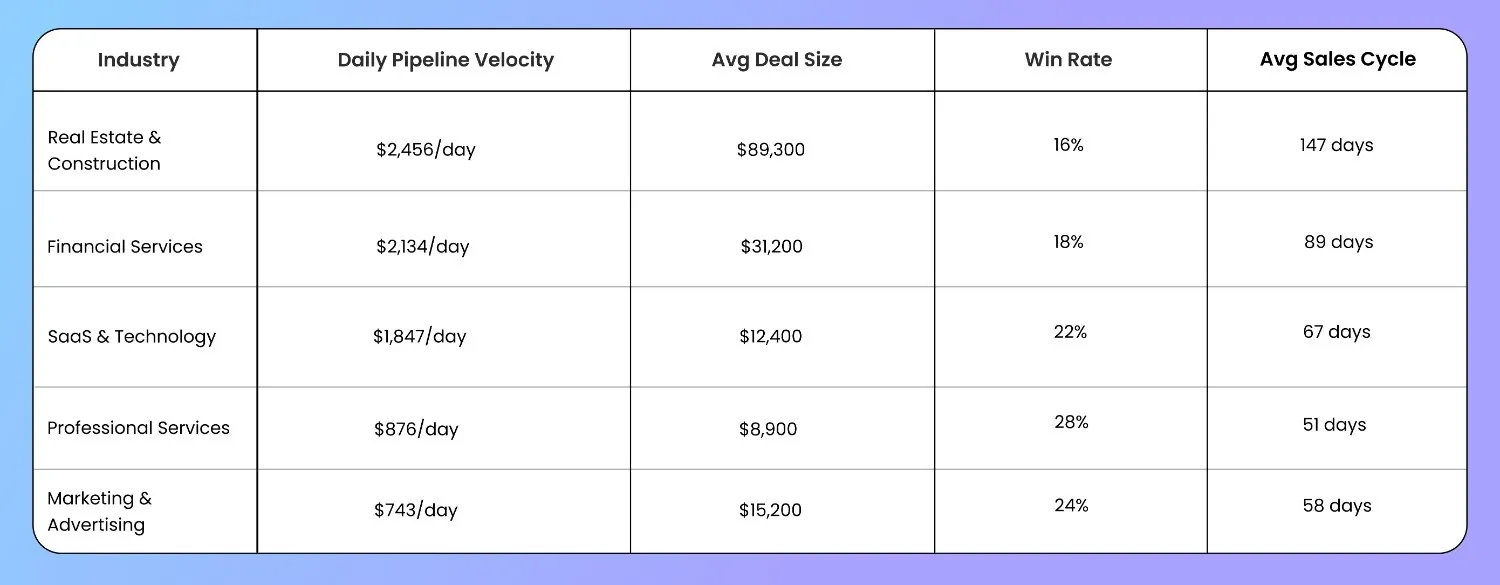
The key insight: High velocity doesn't always mean high win rates. Real Estate leads in daily velocity despite a below-average 16% win rate because deal sizes compensate. Professional Services has the best win rate but the lowest velocity because deal sizes are small. Knowing your industry's profile tells you which factor to pull first.
How to Improve Sales Pipeline Velocity: The 4 Factors
Improving sales pipeline velocity means identifying which of the four formula inputs is causing drag and targeting it specifically. Here's how to move each one.
1. Increase Qualified Opportunity Volume — Without Diluting Quality
More opportunities increase velocity only if quality stays high. Flooding your pipeline with unqualified leads inflates the numerator but collapses win rate and extends cycle length, making velocity worse, not better.
Focus demand generation on your highest-converting channels and tighten ICP criteria before scaling volume. This is where your Sales Funnel Automation strategy matters most — automation that qualifies and routes leads faster creates a more actionable pipeline in less time.
2. Grow Average Deal Value Strategically
Larger deals generate more velocity per opportunity, but they often extend the sales cycle, which can offset the gain. The goal is to move upmarket intelligently: pursue higher-ACV segments where your win rate remains competitive, build systematic upsell and cross-sell motions, and train reps to lead with account-specific value rather than generic pitches.
3. Improve Win Rate Through Enablement and Qualification
Win rate is the most impactful variable in the sales velocity formula. Moving from 20% to 25% doesn’t just add 5% more revenue. It increases the revenue value of every deal in your pipeline by 25%. That compounding effect is why sales leaders should prioritize win rate improvements above almost everything else.
The most reliable ways to improve win rate include tighter qualification frameworks (MEDDIC, BANT), deal-stage-specific enablement content, systematic win/loss analysis, and coaching based on rep-level velocity data. Your CRM automation strategies also play a key role—accurate, consistent CRM data ensures your win rate analysis is reliable rather than misleading.
4. Reduce Sales Cycle Length to Accelerate Revenue Flow
Every extra day in your sales cycle is revenue delayed. B2B sales cycles have grown 32% since 2021 (Gradient Works 2024 B2B Sales Benchmarks), which means this factor has become the most urgent velocity problem for most teams.
Practical ways to shorten cycles: enforce documented exit criteria at each pipeline stage so deals don't stagnate on optimism, multi-thread early by engaging all key stakeholders in the first two conversations, and respond to inbound signals faster — HubSpot's 2024 Sales Trends Report shows 35–50% of deals go to the first responder. Speed at the top of the funnel compounds into faster cycles throughout.
The One Thing That Breaks Sales Pipeline Velocity: Bad CRM Data
Even a perfect strategy for improving sales pipeline velocity collapses without clean data inputs. 91% of CRM databases contain incomplete data, and 70% of records go stale every year (Prospeo Pipeline Analysis).
When win rates are calculated on stale opportunities, when close dates haven't been updated in 60 days, and when reps log total contract value instead of annual value, your velocity number becomes fiction.
Establish weekly CRM hygiene as a non-negotiable: close out dead opportunities, enforce stage progression with exit criteria, and set automated alerts for deals inactive beyond your average cycle length. Clean inputs are what separate velocity as a genuine forecasting tool from velocity as a vanity metric that looks good on a dashboard and means nothing.
Final Thought: Stop Hoping the Pipeline Converts. Start Knowing
Sales pipeline velocity is a shift from reactive revenue management to predictive revenue engineering.
Instead of waiting for quarter-end to discover what closed and what didn’t, you build a system where every revenue variable is tracked, every constraint surfaces before it costs you the quarter, and every forecast is grounded in how fast money is actually moving — not how much is sitting in the CRM.
Marketing and sales teams that invest in velocity tracking today are building something that compounds:
Forecasts that hold in board conversations
Revenue gaps are identified weeks before they become misses
A shared metric that aligns sales, marketing, and RevOps around the same outcome
In a market where B2B sales cycles are longer and buyers are harder to reach, your competitive advantage is simple: move deals faster, with cleaner data, than your competitors do.
If your pipeline looks healthy but your revenue remains unpredictable, the problem isn't your funnel size — it's your funnel speed.
Want more actionable insights on improving revenue performance? Explore the Marketricka blogs for simple, practical strategies that help you scale faster.